Cookie consent
By entering and using this site, you consent to the use of only necessary cookies to enhance your site experience and improve our services.
%20(3).png)
Stay informed about ongoing developments and gain insights into bug fixes and exciting feature releases within WineDirect Classic.
“Great onboarding support and a huge library of online documentation and training videos"
Eric Cavatore
Crossing Vineyards & Winery
%20(2).png)
%20(1).png)
From our enriching academy and insightful blogs to in-depth guides and on-demand training videos, we've curated a wealth of resources to empower your wine-selling journey.
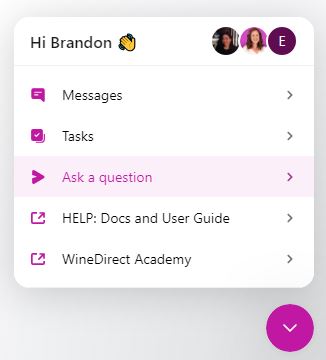
Log in to WineDirect, then find and click on the wineglass icon at the bottom right. Once open, select the 'Ask a question' tab.